- Previous best
- 0.722690
- EvoDuet
- 0.722906
- Objective
- Held-out score ↑
- Run cost
- $38.45
Source
Python
# EVOLVE-BLOCK-START
import numpy as np
import scipy.sparse as sp
import graphtools
import scprep


def _as_counts(X):
    """Return X as a finite dense nonnegative floating-point matrix."""
    x = np.asarray(scprep.utils.toarray(X), dtype=np.float64)
    return np.maximum(np.nan_to_num(x, nan=0.0, posinf=0.0, neginf=0.0), 0.0)


def _backproject(graph, values, approximate):
    """Map graph coordinates back to the original gene space."""
    y = scprep.utils.toarray(values)
    if approximate:
        y = graph.inverse_transform(y, columns=None)
    return np.asarray(y, dtype=np.float64)


def _diffuse(op, values, steps):
    """Apply a sparse diffusion operator repeatedly."""
    y = values
    for _ in range(int(steps)):
        y = op.dot(y)
    return np.asarray(scprep.utils.toarray(y), dtype=np.float64)


def _leave_one_out_operator(op):
    """Remove graph self-loops and renormalize rows for noise-independent smoothing."""
    p = op.tocsr(copy=True) if sp.issparse(op) else sp.csr_matrix(op)
    p.setdiag(0.0)
    p.eliminate_zeros()
    rows = np.asarray(p.sum(axis=1)).ravel()
    inv = np.zeros_like(rows, dtype=np.float64)
    good = rows > 1e-12
    inv[good] = 1.0 / rows[good]
    q = sp.diags(inv).dot(p).tocsr()

    # Extremely degenerate rows should retain a valid stochastic transition.
    bad = np.flatnonzero(~good)
    if bad.size:
        q = q.tolil()
        q[bad, bad] = 1.0
        q = q.tocsr()
    return q


def _gene_calibration(prediction, observed, strength):
    """Correct predicted gene frequencies conservatively toward training frequencies."""
    if strength <= 0:
        return prediction
    eps = 1e-12
    p = np.maximum(prediction.sum(axis=0), 0.0)
    q = np.maximum(observed.sum(axis=0), 0.0)
    p /= max(float(p.sum()), eps)
    q /= max(float(q.sum()), eps)
    ratio = np.clip((q + eps) / (p + eps), 0.88, 1.14)
    return prediction * np.power(ratio[None, :], float(strength))


def _poisson_shrink(prediction, gene_mean, strength):
    """Apply smooth abundance-dependent shrinkage to fractional predictions."""
    if strength <= 0:
        return prediction
    rarity = (
        0.76
        + 1.18 / (gene_mean + 1.0)
        + 0.20 / np.sqrt(gene_mean + 0.15)
    )
    rarity = np.clip(rarity, 0.76, 2.55)
    threshold = float(strength) * rarity[None, :]
    p = np.maximum(prediction, 0.0)
    return p * p / (p + threshold)


def magic_denoise(
    X,
    knn=5,
    t=3,
    n_pca=100,
    solver="approximate",
    decay=1,
    knn_max=None,
    random_state=None,
    n_jobs=1,
    verbose=False,
    shrink=0.09,
    gene_calibration=0.25,
    raw_anchor=0.10,
    positive_anchor=0.02,
    log_mix=0.20,
    loo_mix=0.55,
    **kwargs,
):
    """Denoise counts with square-root MAGIC and leave-one-out diffusion.

    A graph is built from library-normalized square-root counts.  Diffusion
    estimates are formed from both the usual operator and a self-loop-free,
    row-renormalized operator; their mixture reduces self-referential
    overfitting while retaining the local structure that benefits log-space
    error.  Estimates are transformed back to count scale, shrunk for rare
    genes, calibrated globally, and weakly blended with log-normalized
    diffusion.
    """
    x = _as_counts(X)
    if x.ndim != 2:
        raise ValueError("X must be a two-dimensional count matrix")

    n_cells, n_genes = x.shape
    if n_cells <= 1 or n_genes == 0:
        return x.copy()

    k = min(max(int(knn), 1), n_cells - 1)
    if knn_max is None:
        kmax = max(k + 1, 3 * k)
    else:
        kmax = int(knn_max)
    kmax = min(max(k, kmax), n_cells - 1)
    steps = max(1, int(t))

    root = np.sqrt(x)
    root_norm, root_lib = scprep.normalize.library_size_normalize(
        root, rescale=1, return_library_size=True
    )
    root_norm = _as_counts(root_norm)
    root_lib = np.maximum(
        np.asarray(root_lib, dtype=np.float64).reshape(-1), 1e-10
    )

    if n_pca is None or int(n_pca) <= 0:
        pca_dim = None
    else:
        pca_dim = min(int(n_pca), n_genes, max(1, n_cells - 1))

    graph = graphtools.Graph(
        root_norm,
        n_pca=pca_dim,
        knn=k,
        knn_max=kmax,
        decay=decay,
        thresh=1e-4,
        random_state=random_state,
        n_jobs=n_jobs,
        verbose=0,
    )

    approximate = str(solver).lower() == "approximate"
    base = graph.data_nu if approximate else graph.data
    normal_op = graph.diff_op
    loo_op = _leave_one_out_operator(normal_op)

    weights = np.arange(steps, 0, -1, dtype=np.float64)
    weights *= 0.88 / max(float(weights.sum()), 1e-12)

    normal = 0.12 * np.maximum(
        _backproject(graph, base, approximate), 0.0
    )
    loo = np.zeros_like(normal)

    for i in range(steps):
        normal_state = _diffuse(normal_op, base, i + 1)
        loo_state = _diffuse(loo_op, base, i + 1)
        normal += weights[i] * np.maximum(
            _backproject(graph, normal_state, approximate), 0.0
        )
        loo += weights[i] * np.maximum(
            _backproject(graph, loo_state, approximate), 0.0
        )

    # Low-capture cells benefit more from independent neighbors; higher-quality
    # cells retain somewhat more of the conventional MAGIC estimate.
    median_lib = max(float(np.median(root_lib)), 1e-10)
    quality = np.clip(root_lib / median_lib, 0.25, 4.0)
    capture = quality / (1.0 + quality)
    loo_weight = np.clip(
        float(loo_mix) * (1.20 - 0.65 * capture),
        0.20,
        0.82,
    )
    smooth = (
        loo_weight[:, None] * loo
        + (1.0 - loo_weight[:, None]) * normal
    )

    gene_mean = np.mean(x, axis=0)
    capture_anchor = np.clip(
        float(raw_anchor) * (0.40 + 0.60 * capture),
        0.0,
        0.18,
    )
    gene_anchor = 0.72 + 0.55 * gene_mean / (gene_mean + 1.0)
    anchor = np.clip(
        capture_anchor[:, None] * gene_anchor[None, :],
        0.0,
        0.20,
    )

    observed_stabilized = root_norm * root_norm * root_lib[:, None]
    smooth = (1.0 - anchor) * smooth + anchor * observed_stabilized

    den = np.square(np.maximum(smooth, 0.0))
    den *= root_lib[:, None]
    den = _poisson_shrink(den, gene_mean, max(float(shrink), 0.0))
    den = _gene_calibration(den, x, float(gene_calibration))

    # Log-space diffusion is restricted by empirical gene support, preventing
    # rare genes from receiving many harmful sub-molecule predictions.
    lm = np.clip(float(log_mix), 0.0, 0.24)
    if lm > 0:
        library = np.maximum(x.sum(axis=1, keepdims=True), 1e-10)
        log_x = np.log1p(x / library * 10000.0)
        log_smooth = 0.12 * log_x
        for i in range(steps):
            log_smooth += weights[i] * _diffuse(
                normal_op, log_x, i + 1
            )

        log_pred = np.expm1(np.maximum(log_smooth, 0.0))
        total = np.maximum(den.sum(axis=1, keepdims=True), 1e-10)
        p = den / total
        q = log_pred / np.maximum(log_pred.sum(axis=1, keepdims=True), 1e-10)

        support = np.clip(
            0.25 + 1.10 * gene_mean / (gene_mean + 0.35),
            0.25,
            1.0,
        )
        mix = np.clip(lm * support[None, :], 0.0, 0.24)
        den = ((1.0 - mix) * p + mix * q) * total

    # Preserve a small amount of observed positive evidence, but do not
    # manufacture additional signal from zeros.
    pa = np.clip(float(positive_anchor), 0.0, 0.08)
    if pa > 0:
        total = np.maximum(den.sum(axis=1, keepdims=True), 1e-10)
        observed_profile = x / np.maximum(x.sum(axis=1, keepdims=True), 1e-10)
        observed_profile *= total
        confidence = np.clip(
            pa * (0.55 + 0.75 * x / (x + 1.5)),
            0.0,
            0.055,
        )
        den = np.where(
            x > 0,
            (1.0 - confidence) * den + confidence * observed_profile,
            den,
        )

    return np.maximum(
        np.nan_to_num(den, nan=0.0, posinf=0.0, neginf=0.0),
        0.0,
    )


# EVOLVE-BLOCK-END
Requires the original benchmark harness and dependencies.
Score history 100 iterations
Score history
Best-so-far search-time score ↑ · each new best is colored by that iteration’s gate decision
Search-time scores; the final native objective is reported above.
Run details
A denoising program that combines library-size normalization, graph-based smoothing, and count-aware estimates.
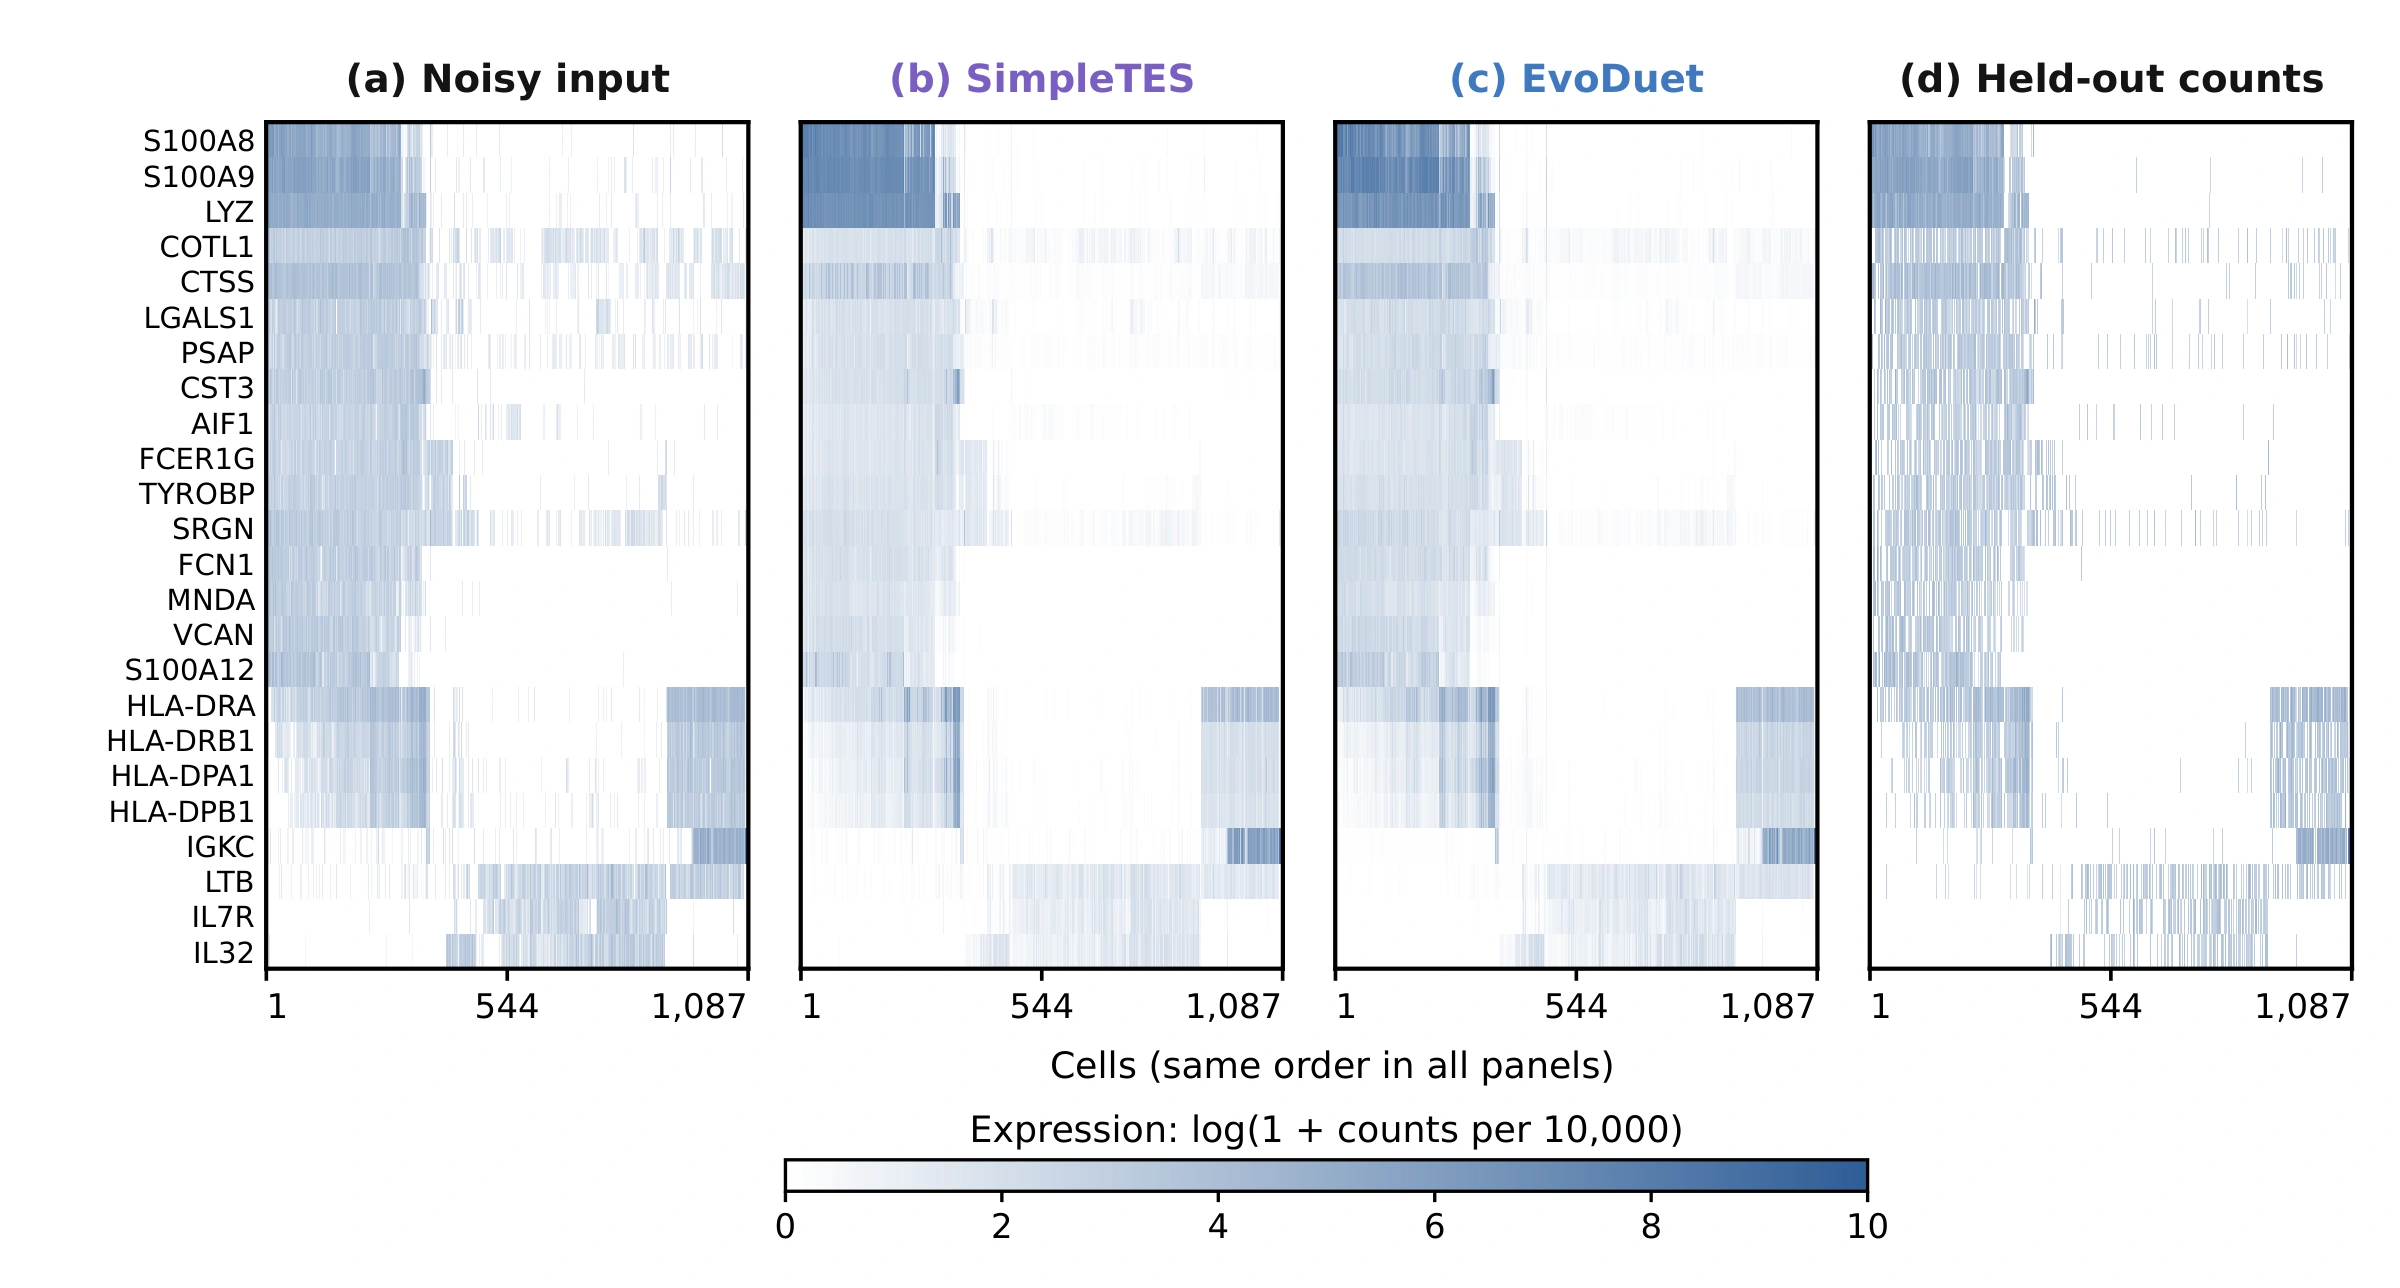
The headline is the recorded PBMC/Tabula held-out mean. The expression window is a visualization of a PBMC replay, not a new aggregate evaluation.
Recorded score: 0.7229058589674775 · reference: 0.7226904858837242 · seed: 42.
Program ID: a425368e-b9f6-4abf-9420-2c2f363d3dca
Source SHA-256: 6dfe6028f7f4584dce801d2b4ee6c8c023a16003e19147557956171833202166
History SHA-256: 62a353bc6e6e111ba5d120f8afa3528b8f0827db9b1774f419260605ce85b2e6